It’s almost time to go to Vienna again for the 2017 General Assembly of the European Geoscience Union, or #EGU17. It’s promising to be another awesome week of science, schnitzel, and the collection of cold bugs from around the globe. Incredibly, it will be my fifth EGU, and I have the pleasure of being joined by a couple of first-timers from my research group – I’m looking forward to showing them the ropes.
I have two oral abstracts and a poster at this year’s meeting –
EGU2017-15699 | Orals | GM3.3/SSS3.13/TS4.6
LEMSI – The Landscape Evolution Model Sensitivity Investigation
Wed, 26 Apr, 16:30–16:45, Room N1
This talk will show the results from our global sensitivity analysis of the CAESAR-Lisflood model. This has been a large piece of modelling work, and seems to have been going forever. Our computers have been busy for well over a year, so it’s great to get the results out there.
EGU2017-12624 | Posters | GM3.3/SSS3.13/TS4.6 | | Highlight
Influence of Rainfall Product on Hydrological and Sediment Outputs when Calibrating the STREAP Rainfall Generator for the CAESAR-Lisflood Landscape Evolution Model
Wed, 26 Apr, 17:30–19:00, Hall X2
This poster has been selected by the session conveners as being of public interest. We’ve used a rainfall generator to produce ensembles of high spatial and temporal resolution rainfall, and used this to drive the CAESAR-Lisflood model – the results are very interesting indeed!
EGU2017-764 | Orals | EOS5
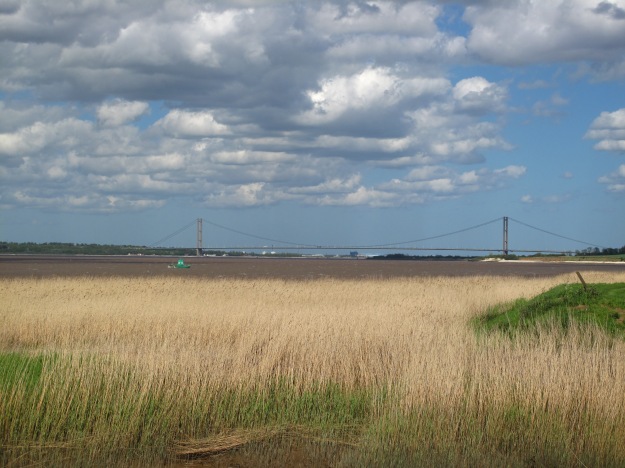
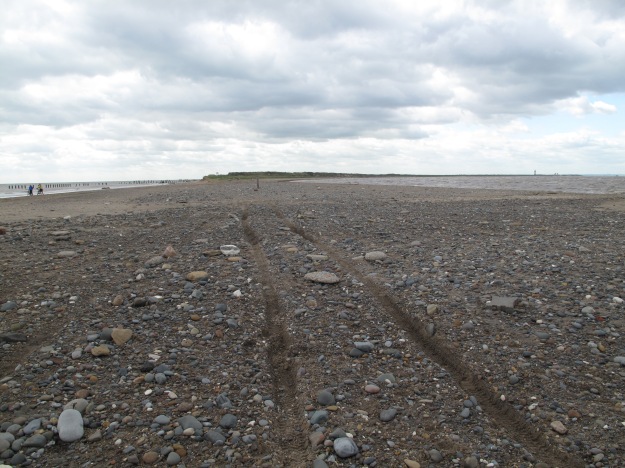
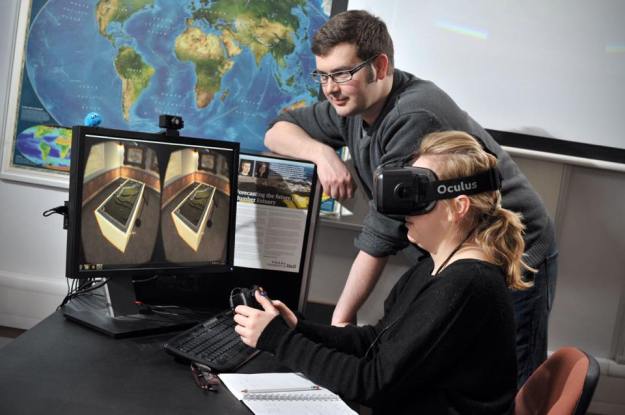
SeriousGeoGames – Geoscience Virtual Reality Experiences for Festival Settings
Thu, 27 Apr, 10:45–11:00, Room L4/5
My final talk is something a little different, and will be summarising the SeriousGeoGames project the best I can in 12 minutes! I will show a little of Humber in a Box and Flash Flood!, and sum up their successes. For a preview, check out the brand new Flash Flood! YouTube Free60 –
Please do come find me and say “hi”, or “Oi, your research is rubbish”, and if you have something you think I should see, let me know.
See you in Vienna!